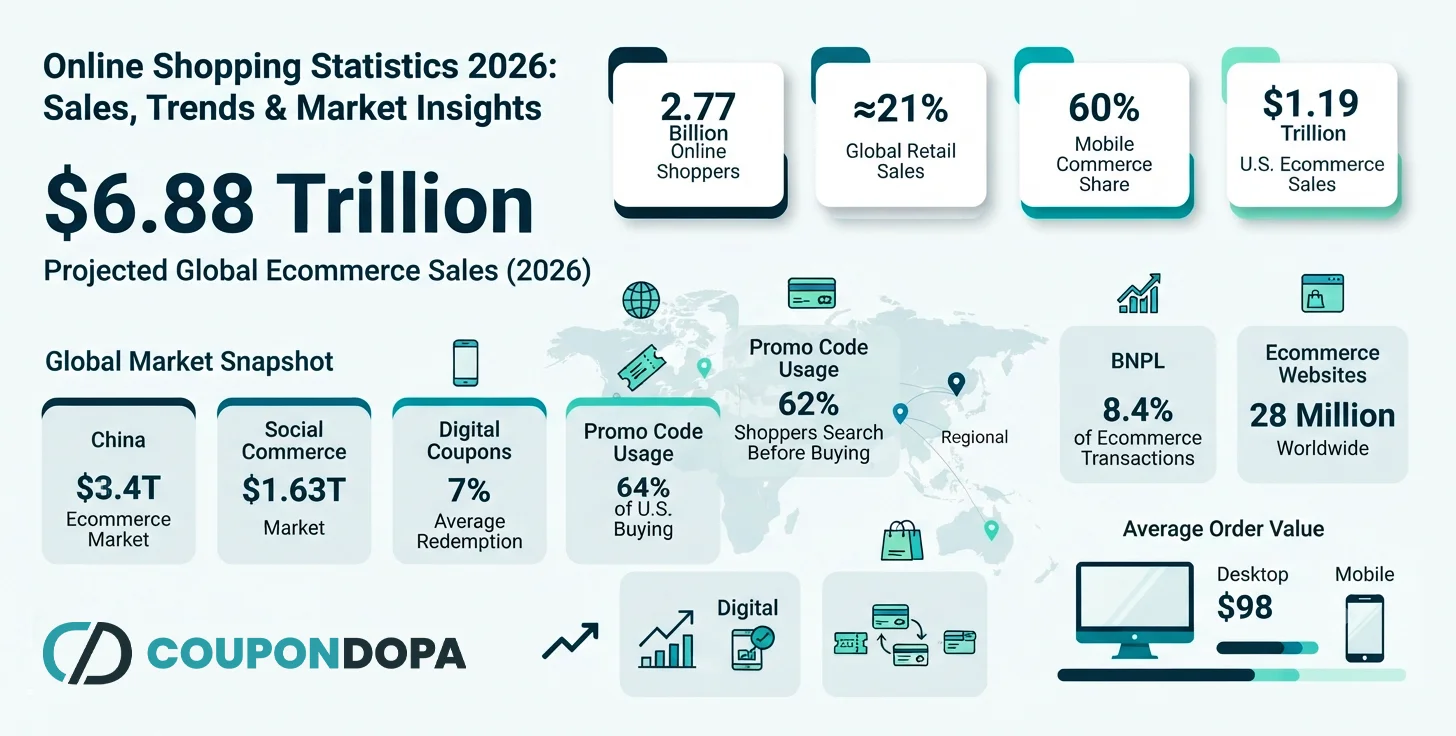
Online shopping keeps growing faster than almost anyone predicted a decade ago. Global online sales are set to pass $6.8 trillion in 2026, and more than a 3rd of the world now buys something online at least once a year. These online shopping statistics matter because they show where consumer money is actually going, not where marketers think it's going. Look at the online shopping industry statistics closely enough, and a clear pattern emerges: growth isn't slowing down; it's just shifting where and how people spend.
This report is built for anyone who needs the real numbers: online sellers, affiliate marketers, journalists, students, and everyday shoppers who just want to know if online deals are still worth chasing. You'll find global sales figures, U.S.-specific data, coupon usage numbers, age breakdowns, and a straight comparison between online and in-store shopping. The data comes from trusted research groups like Statista, eMarketer, the U.S. Census Bureau, and Shopify Research, combined with editorial observations from the Coupondopa team where relevant.
Key Online Shopping Statistics 2026
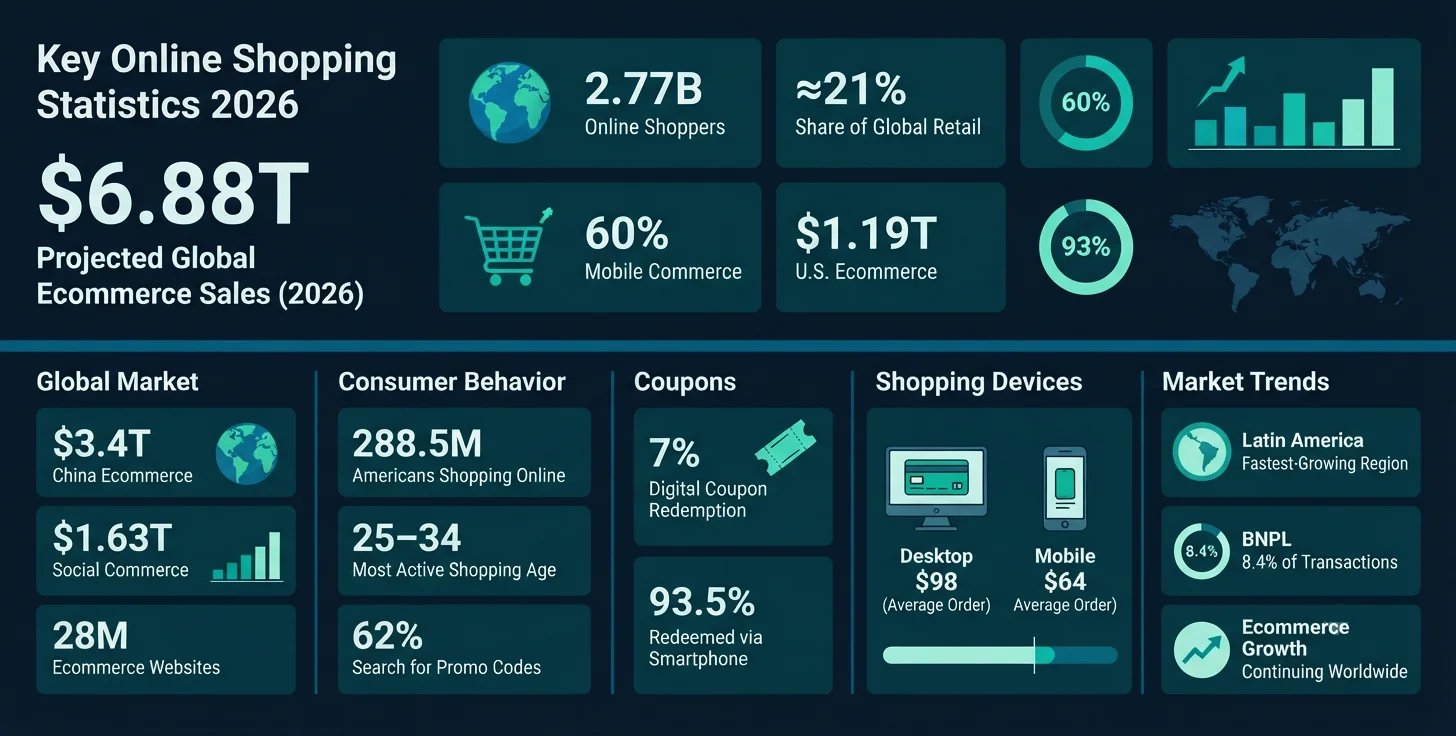
Here are the online shopping figures that matter most right now, pulled together so you don't have to dig for them. (Please attach the link of sources from where you get these information)
-
Global ecommerce sales are projected to reach $6.88 trillion in 2026, up from roughly $6.42 trillion in 2025. (Soruce: Statista/Shopify)
-
Ecommerce now makes up about 20.5% to 21.1% of total global retail sales, up from 19.9% in 2024. (Soruce: eMarketer, Shopify Research)
-
There are an estimated 2.77 billion online shoppers worldwide as of 2025. (Soruce: Statista)
-
Online shoppers represent roughly 33% of the global population across all ages. (Soruce: Capital One Shopping Research)
-
Mobile commerce accounts for about 59–60% of global online retail sales. (Soruce: Statista, 2025)
-
In the U.S., mobile's share of ecommerce sits closer to 44.6%, with desktop still handling a meaningful share of larger purchases. (Soruce: EmberTribe)
-
U.S. retail ecommerce sales hit a record $1.19 trillion in 2025, up from $297 billion in 2014. (Soruce: U.S. Census Bureau)
-
288.5 million Americans made at least one online purchase in 2025, about 80.4% of the population. (Soruce: Capital One Shopping Research)
-
China's online sales topped $3.4 trillion in 2025, making it the largest single ecommerce market. (Soruce: eMarketer)
-
The global social commerce market was valued at roughly $1.63 trillion in 2025. (Soruce: Mordor Intelligence)
-
Digital coupons carry an average redemption rate of about 7%, far above the roughly 0.9% rate for coupons overall. (Soruce: Capital One Shopping Research, Demandsage)
-
93.5% of digital coupon users redeem their coupons on a smartphone. (Soruce: Capital One Shopping Research)
-
Around 62% of U.S. shoppers actively look for a promo code before completing an online purchase. (Soruce: Demandsage)
-
Average order value on desktop runs higher than mobile about $98 versus $64 in recent data. (Soruce: Adobe Analytics-based research)
-
Latin America is the fastest-growing ecommerce region in 2025, with Argentina, Brazil, and Mexico making up 84.5% of the region's sales. (Soruce: Shopify Research)
-
Western Europe's ecommerce market is growing at a steadier pace, around 4% annually, and is on track to pass $800 billion by the end of the decade. (Soruce: eMarketer)
-
B2B ecommerce is valued at roughly $36 trillion as of 2026, dwarfing consumer retail in dollar terms. (Soruce: U.S. International Trade Administration)
-
There are about 28 million ecommerce websites operating worldwide as of 2026. (Soruce: SellersCommerce)
-
Buy Now, Pay Later (BNPL) usage on ecommerce transactions roughly doubled year over year, moving from about 4.2% to 8.4% of transactions. (Soruce: Adobe Digital Insights)
-
Adults aged 25–34 remain the most active online shopping group, making up close to 28% of visits on major marketplaces like Amazon. (Soruce: Amazon sales-share data via Notta.ai)
-
Clothing remains one of the categories with the highest online return rates, driven mainly by sizing and fit problems. (Soruce: Statista Consumer Insights)
Global Online Shopping Statistics
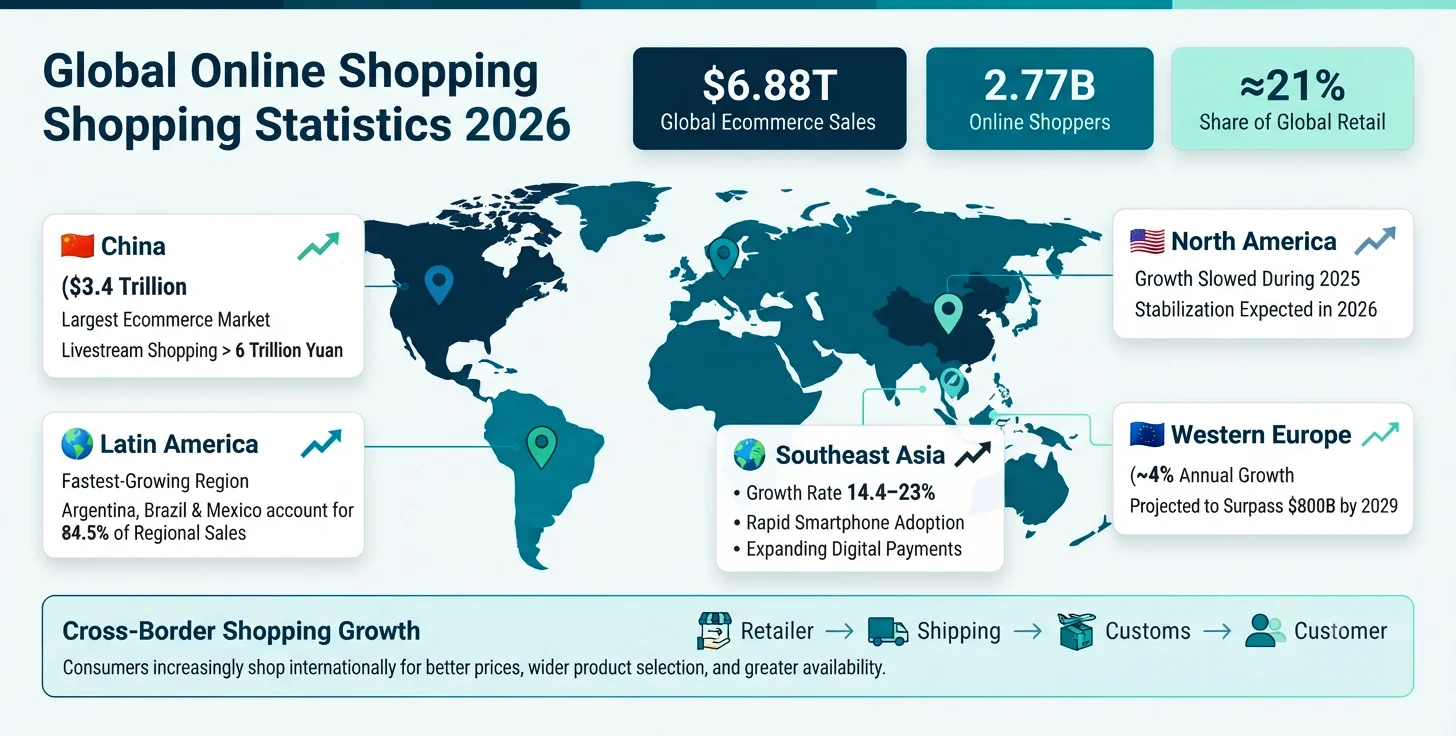
Ecommerce isn't growing evenly around the world, and that unevenness tells its own story. Online shopping statistics worldwide show China, the United States, and Western Europe together account for more than $5.17 trillion of global online sales three regions still doing most of the heavy lifting.
China alone generated over $3.4 trillion in online sales in 2025, helped along by huge livestream shopping platforms like Douyin and Taobao Live. China's livestream shopping market alone is expected to top 6 trillion yuan in 2025.
Growth patterns look different depending on where you look:
-
Latin America: the fastest-growing major region, fueled by rising smartphone penetration and improving digital payment infrastructure.
-
Southeast Asia: projected growth rates as high as 14.4% to 23% in the near term, among the strongest anywhere.
-
North America: growth has slowed somewhat in 2025 due to tariff pressure and softer consumer confidence, though forecasts point toward stabilisation through 2026.
-
Western Europe: steady, predictable growth near 4% a year, expected to cross $800 billion by 2029.
Cross-border shopping keeps expanding too, as shoppers increasingly buy from retailers outside their own country when the price or selection is better. This is part of why international shipping and customs handling have become bigger talking points for online retailers over the past two years.
Online Shopping Sales Statistics
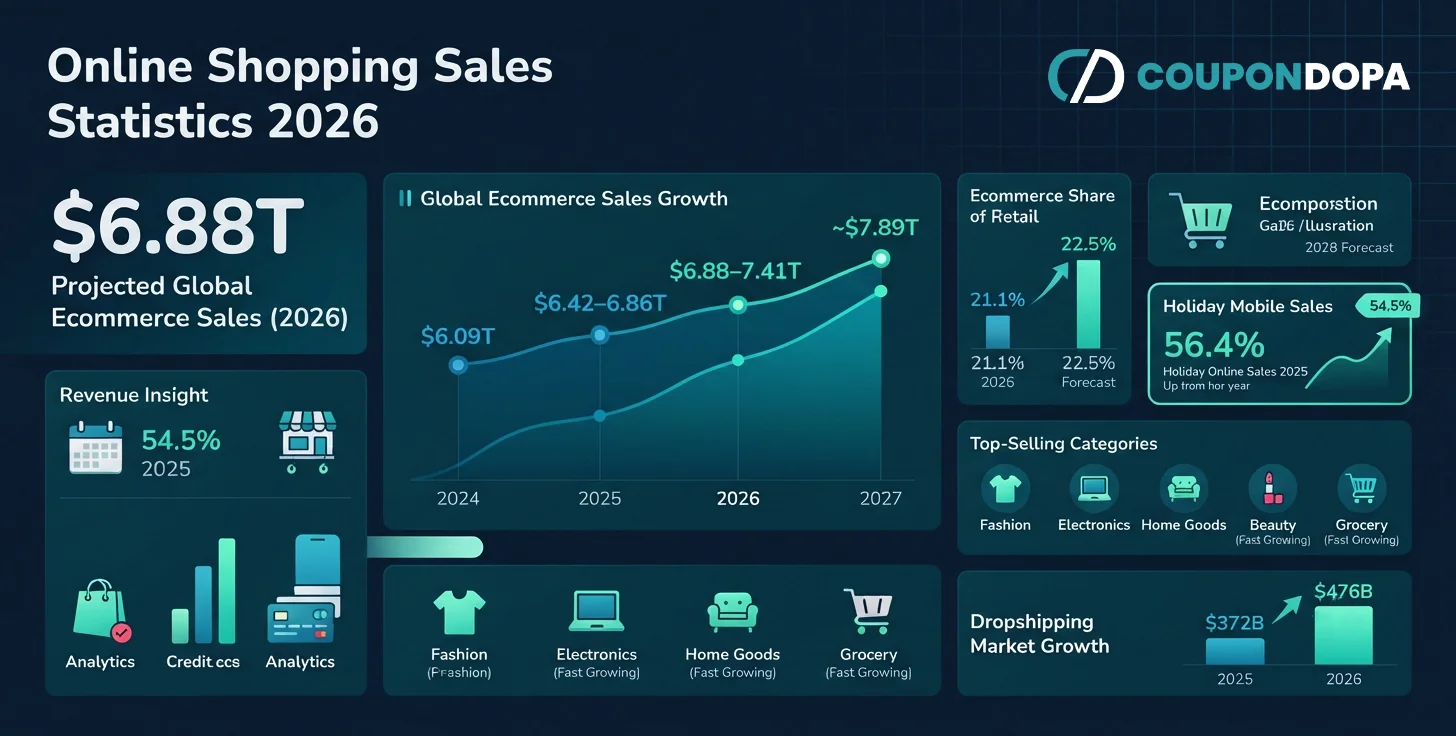
Ecommerce revenue keeps climbing, though growth rates vary depending on the source and the exact measurement window. One thing every major research firm agrees on: online sales are still growing roughly twice as fast as physical retail.
|
Year |
Global Ecommerce Sales (est.) |
YoY Growth |
|
2024 |
~$6.09 trillion |
8.8% - 14.6% |
|
2025 |
~$6.42–6.86 trillion |
~6.8% |
|
2026 |
~$6.88–7.41 trillion |
~6–8% |
|
2027 (projected) |
~$7.89 trillion |
~8-10% |
Figures vary slightly by source (Statista, eMarketer, Shopify Research) depending on measurement methodology.
A few other sales-specific numbers worth knowing:
-
Ecommerce's share of total retail sales is expected to climb from about 21.1% in 2026 to 22.5% by 2028.
-
Holiday shopping remains the single biggest sales spike of the year, with mobile representing 56.4% of all online sales during the November–December 2025 holiday period, up from 54.5% the year before.
-
Fashion, electronics, and home goods continue to top the list of highest-selling online categories, with beauty and grocery gaining ground quickly.
-
The global dropshipping market, closely tied to ecommerce sales growth, was valued at roughly $372 billion in 2025 and is projected to hit $476 billion in 2026.
Online Shopping Trends in 2026
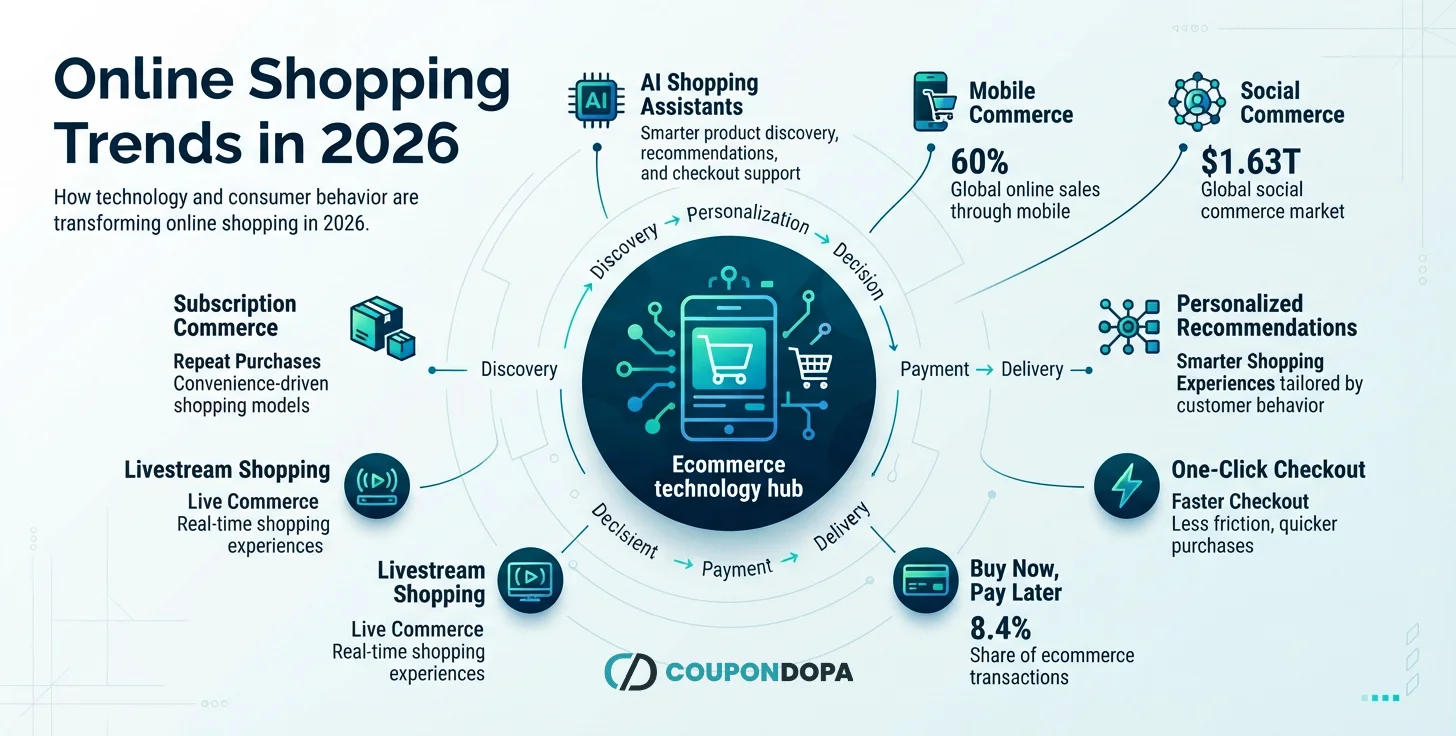
A handful of trends in online shopping are reshaping how people buy this year, and each one matters for a different reason.
AI shopping assistants: More retailers now use AI tools to answer product questions, suggest sizes, and speed up checkout. The gap between "just browsing" and "ready to buy" keeps shrinking as a result.
Personalized recommendations: Product suggestions based on browsing history and past purchases are driving a growing share of ecommerce revenue, especially on marketplaces with large catalogs.
Social commerce: Buying directly through Instagram, TikTok, or Facebook shops is no longer a niche behavior. The global social commerce market sat around $1.63 trillion in 2025, and platforms like Douyin have seen transaction values jump dramatically over the past few years.
Mobile commerce: With mobile now responsible for roughly 60% of global online transactions, checkout speed and mobile page load times directly affect whether a sale gets finished.
Voice commerce: Still a small slice of total sales, but growing as smart speakers and voice assistants get better at handling simple reorders.
One-click checkout: Saved payment details and simplified checkout flows are reducing cart abandonment, particularly on mobile where slow forms cost sales fastest.
Buy Now, Pay Later (BNPL): Usage nearly doubled year over year, now covering about 8.4% of online transactions. It's especially popular with younger shoppers, with Gen Z and Millennials showing the highest adoption rates.
Livestream shopping: Enormous in China, and slowly gaining traction in Western markets as brands experiment with real-time product demos tied directly to checkout links.
Subscription commerce: Recurring delivery models for everything from razors to pet food continue expanding, giving retailers more predictable revenue and shoppers more convenience.
Coupon Usage & Redemption Statistics
Coupons still matter, even in a digital-first shopping world. Arguably more than ever, finding a working code takes seconds now instead of clipping paper.
-
The average digital coupon redemption rate is about 7%, compared to roughly 0.9% for coupons overall (Capital One Shopping Research).
-
Instant redeemable coupons had the highest redemption rate among all coupon types in 2024, at 12.8%.
-
93.5% of digital coupon users redeem their codes using a smartphone, with tablet use trailing far behind at under 42%.
-
Roughly 172.6 million American consumers redeemed a digital coupon in 2025.
-
62% of U.S. shoppers say they specifically look for a promo code before finalizing an online purchase (Demandsage).
-
Digital coupon revenue is projected to hit $12.6 billion in 2026, part of a market expected to keep growing through the decade.
-
Roughly 86% of online shoppers say they're more likely to try a new business if a coupon is offered.
Codes don't always work, and that's usually down to a few predictable reasons: expired offers, single-use restrictions, exclusions on sale items, or region-locked codes that don't apply outside a specific country. This is exactly why Coupondopa ran a large-scale test of real-world coupon reliability see We Tested 1,000 Coupon Codes Across 11 Countries for a breakdown of how often codes actually work in practice.
What Do People Mostly Buy Online?
Category preferences shift a little each year, but the overall ranking has stayed fairly consistent:
-
Fashion and apparel: still the single largest online shopping category worldwide.
-
Electronics: phones, laptops, and accessories remain a top-spending category, especially around major sales events.
-
Beauty and personal care: one of the fastest-growing categories online, helped by subscription boxes and influencer-driven demand.
-
Home goods and furniture: steady growth as more shoppers trust buying larger items sight-unseen.
-
Grocery: smaller as a share of total ecommerce, but growing quickly year over year as delivery services expand.
-
Travel bookings: flights, hotels, and experiences continue to be booked almost entirely online now.
-
Pet products: a smaller category by dollar volume, but one of the more loyal, repeat-purchase segments.
-
Health and wellness products: supplements and over-the-counter items are increasingly bought online rather than in pharmacies.
-
Digital products: software, streaming subscriptions, and e-books round out the list, with high margins but a smaller overall share of total spend.
Online Shopping Age Demographics
Shopping habits vary a lot by generation, from how often people shop to which device they prefer.
|
Age Group |
Shopping Frequency |
Device Preference |
Coupon Usage |
|
18–24 (Gen Z) |
~6.2 times/month |
Mobile-first |
High, especially social-driven codes |
|
25–34 (Younger Millennials) |
Frequent, near-daily browsing |
Mobile and app-based |
High |
|
35–44 (Older Millennials/Gen X) |
~4.8 times/month |
Mixed mobile/desktop |
Moderate to high |
|
45–54 (Gen X) |
~3.1 times/month |
Desktop-leaning |
Moderate |
|
55+ (Baby Boomers) |
~1.4 times/month |
Desktop-preferred |
Lower, but growing |
Frequency figures are approximate averages drawn from Pew Research and Capital One Shopping Research data.
A few extra data points worth flagging:
-
Adults aged 25–34 are the most active online shoppers overall, making up close to 28% of visits on major marketplaces like Amazon.
-
Gen Z shoppers report the highest monthly shopping frequency of any generation, and 53% made a purchase directly through a social media platform in 2024.
-
Millennials spent noticeably more than other generations during the 2025 holiday season about $833 more than Gen Z shoppers and just over $1,000 more than Baby Boomers.
-
Older shoppers (55+) are far less likely to use Buy Now, Pay Later, with adoption sitting around 19%, compared to nearly 40% among Gen Z and Millennials.
U.S. Online Shopping Statistics
The United States remains one of the three biggest ecommerce markets in the world, alongside China and Western Europe.
-
U.S. retail ecommerce sales hit a record $1.19 trillion in 2025 (U.S. Census Bureau).
-
Third-quarter 2025 ecommerce sales alone totaled $299.6 billion, up 5.21% from the same quarter the year before.
-
288.5 million Americans shopped online in 2025, representing about 80.4% of the U.S. population.
-
Roughly 49% of American consumers shop online at least once a week.
-
Mobile's share of U.S. ecommerce sits around 44.6%, lower than the global average, which suggests American shoppers still lean on desktop more for bigger purchases.
-
Holiday ecommerce continues to be the single biggest driver of annual growth, with mobile making up more than half of all online holiday transactions in 2025.
-
Top-selling categories in the U.S. mirror the global pattern: fashion, electronics, and home goods lead, with grocery and beauty growing the fastest.
Online Shopping vs In-Store Shopping Statistics
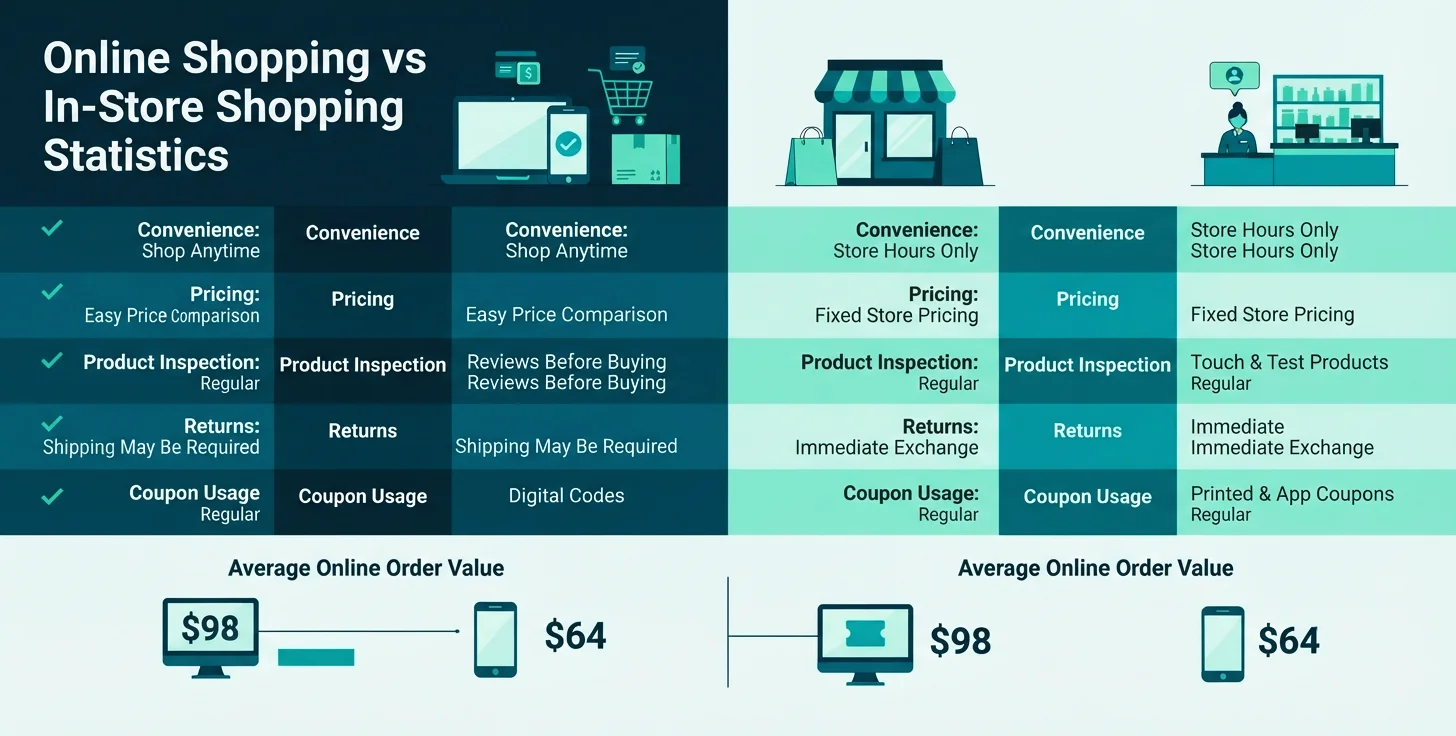
Both shopping methods have real advantages, and the "better" option usually depends on what someone is buying. Most online shopping vs in-store shopping research points to the same conclusion: it's not really a competition, it's a trade-off.
|
Factor |
Online Shopping |
In-Store Shopping |
|
Convenience |
Shop anytime, anywhere |
Limited to store hours |
|
Pricing |
Often lower, easier to compare |
Prices fixed, less room to compare instantly |
|
Trust |
Depends on reviews and seller reputation |
Product seen and handled directly |
|
Returns |
Can be slower, sometimes costly |
Usually immediate |
|
Average Spend |
Higher on desktop ($98 avg.) than mobile ($64 avg.) |
Varies widely by category |
|
Conversion Rate |
Generally lower than in-store |
Higher once a shopper is already in the store |
|
Product Inspection |
Not possible before purchase |
Full physical inspection |
|
Coupon Usage |
High, especially digital codes |
Common with printed or app-based coupons |
That's the core of in-store vs online shopping statistics: online wins on convenience, price comparison, and selection, since you can browse thousands of options from a couch. In-store wins on immediacy, no shipping wait, easier returns, and the chance to physically check an item before paying. Neither format is disappearing; most shoppers now lean on both, depending on what they're buying.
Why People Struggle Shopping Clothes Online
Clothing remains one of the toughest categories to buy online. People struggle shopping clothes online statistics point to a few recurring culprits, and they're pretty consistent across research.
-
Sizing inconsistencies are the most commonly cited frustration; the same "medium" can fit completely differently between brands.
-
Color differences between product photos and the actual item, often caused by screen calibration and lighting in photography.
-
Fabric expectations don't always match reality; a listing might not make clear how thin, stiff, or stretchy a material actually is.
-
Fit problems overall drive a large share of clothing returns, more than almost any other category online.
-
Returns are expensive for retailers and inconvenient for shoppers, which is part of why some brands have started investing in virtual try-on tools and better size guides.
-
Trust takes a hit each time a shopper receives something that doesn't match expectations, which can quietly reduce repeat purchases from that brand.
Affiliate Marketing's Impact on Online Shopping
Affiliate sites, coupon platforms, cashback services, and influencer recommendations all play a real role in how people decide what to buy online.
Coupon and deal websites help shoppers find discounts they might not know existed, while cashback platforms add an extra incentive to complete a purchase through a specific link. Influencer marketing has become one of the most trusted forms of product discovery, especially among younger shoppers who often treat creator recommendations the way earlier generations treated word-of-mouth.
Product reviews whether from bloggers, YouTubers, or dedicated review sites continue to shape purchase decisions heavily, particularly for higher-priced items where shoppers want more reassurance before buying. For a deeper look at how big this industry actually is, see Affiliate Marketing Statistics, Success Rate & Market Size in 2026, and for platform-specific data, Amazon Affiliate Marketing Insights.
Future of Online Shopping (2027–2030)
These are projections, not confirmed facts, but they represent where most industry researchers expect ecommerce to head over the next few years.
-
AI shopping assistants are expected to move from simple chatbots to full personal shopping agents that can compare prices and complete purchases with minimal input.
-
Augmented reality (AR) try-on tools are projected to become standard for fashion and beauty retailers, aimed directly at reducing the clothing fit problems mentioned earlier.
-
Virtual reality (VR) shopping experiences remain early-stage but are expected to grow in specific categories like furniture and home design.
-
Drone delivery is being tested by several major retailers and could become more common for last-mile delivery in dense suburban areas by the end of the decade.
-
Predictive shopping, where retailers anticipate reorders before a shopper even asks, is expected to expand alongside subscription commerce.
-
Automation in fulfillment and customer service will likely keep reducing delivery times and support wait times.
-
Hyper-personalization: recommendations, pricing, and even email timing tailored to individual behavior is expected to become the default rather than the exception.
Key Takeaways
-
Global ecommerce sales are on track to hit roughly $6.88 trillion in 2026.
-
Ecommerce now makes up about 20–21% of total global retail sales.
-
Mobile commerce drives close to 60% of online sales worldwide.
-
The U.S. ecommerce market hit a record $1.19 trillion in 2025.
-
China remains the single largest ecommerce market by sales volume.
-
Digital coupons are redeemed at roughly 7%, far above the overall coupon average.
-
Adults 25–34 are the most active online shopping demographic.
-
Clothing remains the category with the most fit-related return problems.
-
Latin America is currently the fastest-growing ecommerce region.
-
AI tools, AR try-on, and BNPL are reshaping how people shop online right now.
FAQs
What percentage of people shop online?
Roughly a third of the world's population shops online, and in countries like the U.S. that figure rises to about 80% of the population.
How big is the online shopping industry?
Global ecommerce sales are projected to reach roughly $6.88 trillion in 2026, making up about 20–21% of total global retail sales.
Which age group shops online the most?
Adults aged 25–34 are generally the most active online shoppers, though Gen Z shoppers report the highest monthly shopping frequency of any age group.
What products are most commonly purchased online?
Fashion and apparel top the list globally, followed by electronics, beauty products, and home goods.
What is the average coupon redemption rate?
Digital coupons redeem at an average rate of about 7%, compared to roughly 0.9% for coupons across all types.
Is online shopping growing every year?
Yes. Global ecommerce sales have grown consistently year over year, typically outpacing in-store retail growth by a wide margin.
How many people shop online worldwide?
An estimated 2.77 billion people shopped online globally in 2025, a figure expected to keep climbing through 2030.
Does affiliate marketing influence online shopping?
Yes. Coupon sites, cashback platforms, and influencer reviews all play a measurable role in purchase decisions, particularly for shoppers comparing prices or looking for reassurance before buying higher-priced items.